Render igraph networks using Sigma.js - in R - now on CRAN!
Why?
This package is an R interface to the Sigma.js javascript library. Sigma.js was built for graph visualization and has significant advantages over other javascript libraries when creating large graph visualizations.
Benefits of this package:
- Use familiar, well documented
igraphobjects to make visualizations - Easy “ggplot-like” syntax
- Render things quickly - allowing for faster iterative graph building
- Render large networks
- Maintain interactivity (click, hover, zoom) with sharable html output
- Integrate easily with Shiny applications
How?
First, install this package:
install.packages('sigmaNet')Or, use the development version:
devtools::install_github('iankloo/sigmaNet')Then, create an igraph network. Here we’ll use the included les Miserables dataset that maps the co-appearances of characters in the novel.
Note, passing an optional layout to the sigmaFromIgraph() function will dramatically improve speed. Layouts are usually the most computationally intensive task when creating network visualizations. This package allows you to separate this computation from the aesthetic changes you will likely want to make to your visualization.
library(sigmaNet)
library(igraph)

data(lesMis)

layout <- layout_with_fr(lesMis)
sig <- sigmaFromIgraph(lesMis, layout = layout)
sig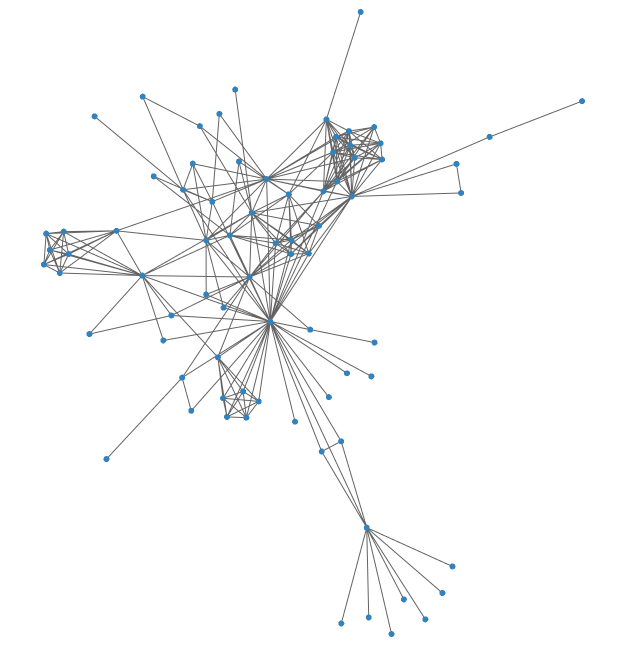
If you render this at home, you’ll see that you can zoom, pan, and get information on-hover for the nodes. This is just a static image to show you the basics.
Options
You have a few options available to change the aesthetics of graphs. Options are applied in a similar way to ggplot, but use the pipe operator instead of the “+”. Here is an example showing most of the options you can use:
data(lesMis)

clust <- cluster_edge_betweenness(lesMis)$membership
V(lesMis)$group <- clust

layout <- layout_with_fr(lesMis)

sig <- sigmaFromIgraph(lesMis, layout = layout) %>%
  addNodeLabels(labelAttr = 'label') %>%
  addEdgeSize(sizeAttr = 'value', minSize = .1, maxSize = 2) %>%
  addNodeSize(sizeMetric = 'degree', minSize = 2, maxSize = 8) %>%
  addNodeColors(colorAttr = 'group', colorPal = 'Set1')
sig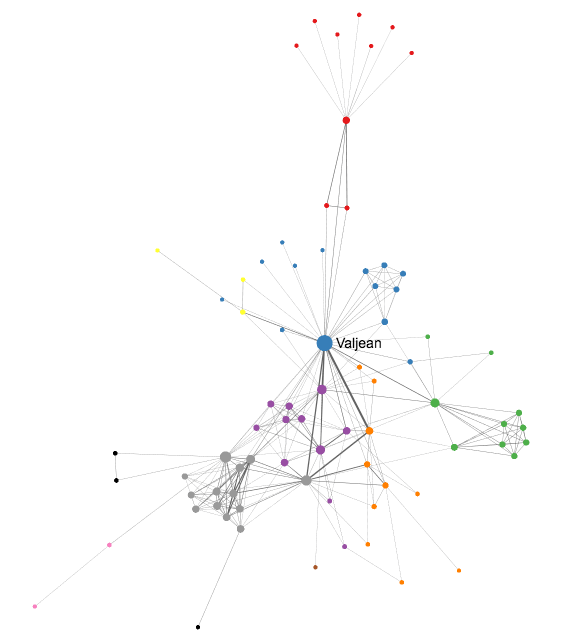
Note: there is no opacity/transparency/alpha attribute! That is because webgl doesn’t support transparency. To mimic transparency, set your edge size to be small - this works really well. I know this is a big trade off, but it is the only way to render large networks without sacrificing performance.
Larger Networks
This package was built to address the specific challenges of creating compelling visualizations with large networks. Here is an example of a larger network than we’ve been using (created using a graph-generating function in igraph):
g <- sample_pa(10000)

layout <- layout_with_fr(g)
sig <- sigmaFromIgraph(g, layout = layout)
sig %>%
  addNodeSize(oneSize = .5) %>%
  addEdgeSize(oneSize = .2)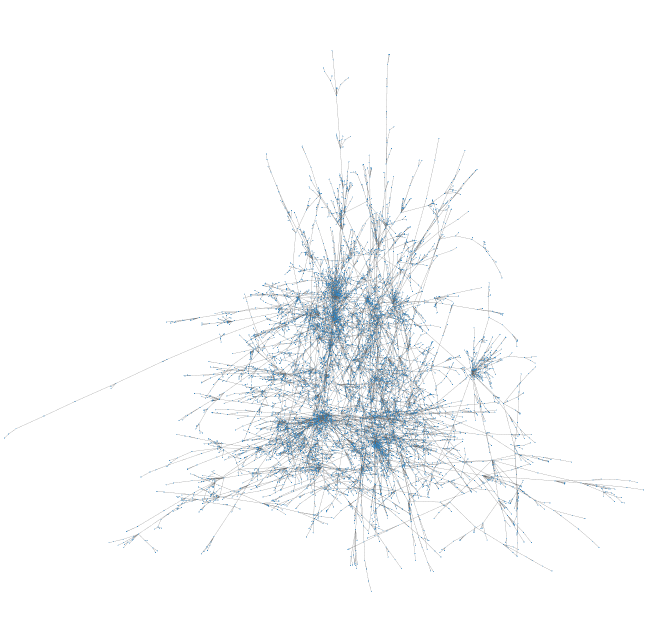
While we can debate the usefulness of a “hairball” graph like this, you can see that sigmaNet has no problem rendering a graph with 10,000 nodes nearly instantly. If you render this at home, you will also see that the graph maintains its interactivity with little to no lag.
Shiny Support
You can use sigmaNet in Shiny using renderSigmaNet() in your server and sigmaNetOutput() in your ui. See the Shiny docs for more general info about Shiny - these functions drop-in just like the basic plotting examples.
Use the addListner() function to specify a Shiny listener. Current options are “clickNode” and “hoverNode”. These are pretty self-explanitory - the first returns information about a node on-click and the second does the same on-hover.
Here’s a minimal Shiny app that sends the result of an on-click event to a text box:
library(sigmaNet)
library(shiny)
library(magrittr)

data(lesMis)

ui <- fluidPage(
  sigmaNetOutput('network', height = '600px'),
  textOutput('text')
)

server <- function(input, output) {
  output$text <- renderText({
    req(input$node_data)
    paste0('You clicked on: ', input$node_data$label)
  })

  output$network <- renderSigmaNet({
    sigmaNet::sigmaFromIgraph(lesMis) %>%
      addNodeLabels(labelAttr = 'label') %>%
      addListener('clickNode')
  })
}

shinyApp(ui, server)
A Note on Browsers
This package uses a renderer that detects whether or not your browser supports webgl. If it does, webgl will be used to render the visualizations. If not, canvas will be used. Webgl is MUCH faster than canvas (especially with large graphs), so if you notice some performance issues, try using a modern browser that supports webgl. All but the most out-of-date browsers support webgl (except maybe Opera?), so this shouldn’t be an issue for many.
Features in development
- GUI to modify aesthetics (Shiny gadget)
Write an “issue” on the github page for this package if you want to see additional features.
Links
- Download from CRAN at
https://cloud.r-project.org/package=sigmaNet - Browse source code at
https://github.com/iankloo/sigmaNet - Report a bug at
https://github.com/iankloo/sigmaNet/issues
Developers
- Ian Kloo
Author, maintainer